
My Investing Playbook
How I invest; Stock picking, Price Action, Position sizing & More.

Here’s your onboarding for our journey to beat the market. I’m going to break down my investment system with a heavy focus on price action - a tool usually ignored by investors. I’ll walk you through how I think, how I pick stocks, how I size positions & what you can expect from this Substack.
In short: markets are noisy and crowded. I don’t try to cover everything. I focus on the few names that can actually generate wealth, the ones worth big allocations, the ones with real potential, the ones that can move the needle if played right. And I focus on playing them well.
I try to only focus on the few bets that really matter.
The Market, Multiples & Momentum
Before talking strategy, we need to talk about how the market works. This isn’t just my opinion, it’s a universal truth even if most investors chose to ignore it.
A stock’s price is the result of two variables.
A financial metric, which reflects the company’s ability to generate cash. That’s what the market craves: safe, consistent cash generation. It is factual & reported every quarter during earning seasons.
A multiple, which represents the market’s trust and expectation of the company’s future cash generation. It is volatile but usually stays within known ranges for each sector.
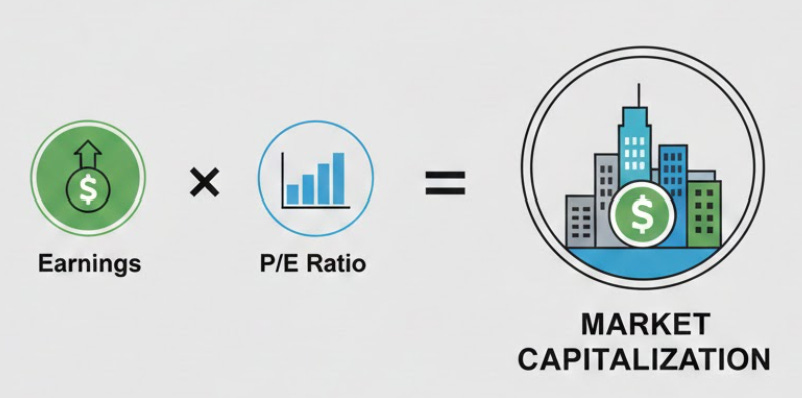
Most investors look at earnings and the P/E ratio. Multiply them and you’ll get the company’s capitalization: the market’s verdict on what the business is worth.
Every company is different. You can’t judge a hyper‑growth tech firm the same way you judge a utility. You have to use the right metric for the right business, which leads to many disagreements, but the principle remains the same for every stock in the markets.
This means a company has two levers to increase its stock’s value.
Increase cash generation
Expand its multiple
The first is straightforward: a healthy company grows, improves margins, and prints more cash. If the multiple stays the same, the stock goes up. Simple.
The second is where the magic happens. Less science, more sentiment. But sentiment also follows some rules and has some specific triggers.
Accelerated Growth: When revenue starts growing faster, the ceiling disappears. The market prices in optimism in the form of higher multiples because it doesn’t know where the limit is. This is growth investing 101.
Margin Expansion: If a company generates more cash from the same revenues, the market rewards that efficiency with a higher multiple.
Increased Safety/Trust: A company that can generate cash for decades safely earns a “trust premium” as the market can anticipate its future.
This is how the market works. Understanding this helps avoid value traps; companies that look cheap but have no path to margin expansion, revenue acceleration, or gain the market’s trust. Without a catalyst, the market simply walks away. A value trap can become a winner, but it needs one of those triggers first.
We don’t buy those. We look for the names the market is about to fall in love with; companies that can accelerate growth or increase cash generation, creating a double appreciation: rising cash and expanding multiples.
That’s what stock picking is about.
My Investment Method.
I can summarize my system in one sentence: Go big on great companies at great prices when the stock is showing appreciation.

The image looks more complex than it is.
Fundamentals
I look for strong fundamentals and simple business models within a positive, high potential narrative. I’m binary here: if I don’t love it, I move on. It’s always better to own a big stake in an excellent stock than a “diversified” pile of mediocre ones.
Understanding a business is step one. It tells you what you own, what its potential is, and what needs to be monitored for the thesis to play out. Most importantly, it keeps you from being shaken out. When you know what you own and why, you sleep fine during volatility, and you can take advantage of it.
This is the first and most important step for success.
Valuation
I use a simple framework based on revenue growth, margins & multiples to project a stock’s price over a 2–5 year horizon, which gives me what I call my OCB - Optimized Cost Basis.
“Valuation” is often just a fancy word for uncertainty. No one knows what growth will look like in five years, but we eventually have to make a call. My method is to find the floor required to generate alpha & then decide whether the company can realistically hit that floor.
I am aware that I’ll be wrong 99% of the time, but this keeps my positions healthy, my prices reasonable & my FOMO in check. If I am wrong, it’s at a reasonable price & for a reasonable loss.
Price Action
This is where I lose the “traditional” investors. Many think you’re either a long‑term investor or a trader. Mention price action or technical analysis and they’ll put you in the trader box.
If that’s your case: I’m neither. I’m a concentrated investor.
My job is to find the best opportunities and capitalize on them, not to hold a business for 30 years through sickness and health. I don’t marry my investments and I don’t like sick names.
Don’t get me wrong: I’m happy to hold a stock for a decade if fundamentals stay strong and the uptrend remains intact. I only buy stocks I’d be comfortable holding for quarters or years. But I’ll cut them loose if things don’t go as planned or if I find better opportunities elsewhere. I focus on performance, not ego.
Price action is another tool. You can’t build conviction from a chart, you can find the company’s value neither, but it tells you something even more important for those who focus on making money: what you should buy and when.
What is Price Action?
The market is a consensus built from millions of interactions and price action is the visualization of that consensus.
A chart tells you who wants what, at what price, and - when combined with research, why. It shows which group is in control at any moment. And that matters for one simple reason: you only make money if your stock goes up.
So I focus on stocks which go up, or stabilize at worse. Because I am here to make money, not to hold an asset until being proven right - if ever.
Ranges, Breakouts, Retests & Averages
Those are the four most important - and only, words one need to understand price action - or technical analysis. It is not complicated, or much less than many make it look like. I rely on these concepts for two reasons.
Human behavior: Price action literally shows what participants are doing. If price moves up, buyers are overwhelming sellers, and vice-versa.
Self‑fulfilling prophecies: These patterns have been watched for centuries. People expect certain reactions at certain levels, so they act accordingly & the pattern reinforces itself.
Ranges are the first sign that selling pressure has exhausted itself. The stock stops falling because buyers are holding the line. Supply and demand finally match. This is the first positive signal we look for: the bleeding has stopped.

They can last weeks or years. The market rewards cash generation; until a company shows clear signs of acceleration, it has no reason to buy the stock at a higher price. So the range continues, and that’s how value traps form.
Then come breakouts, and this is where things get interesting. A breakout happens when buyers overwhelm sellers and agree to pay more. It signals a shift: sellers have vanished. The chart won’t tell you why - that’s your job through fundamentals, but it will tell you the narrative is changing. The stock starts printing Higher Highs and Higher Lows. Buyers are in control, they want in.
Here’s an illustration.
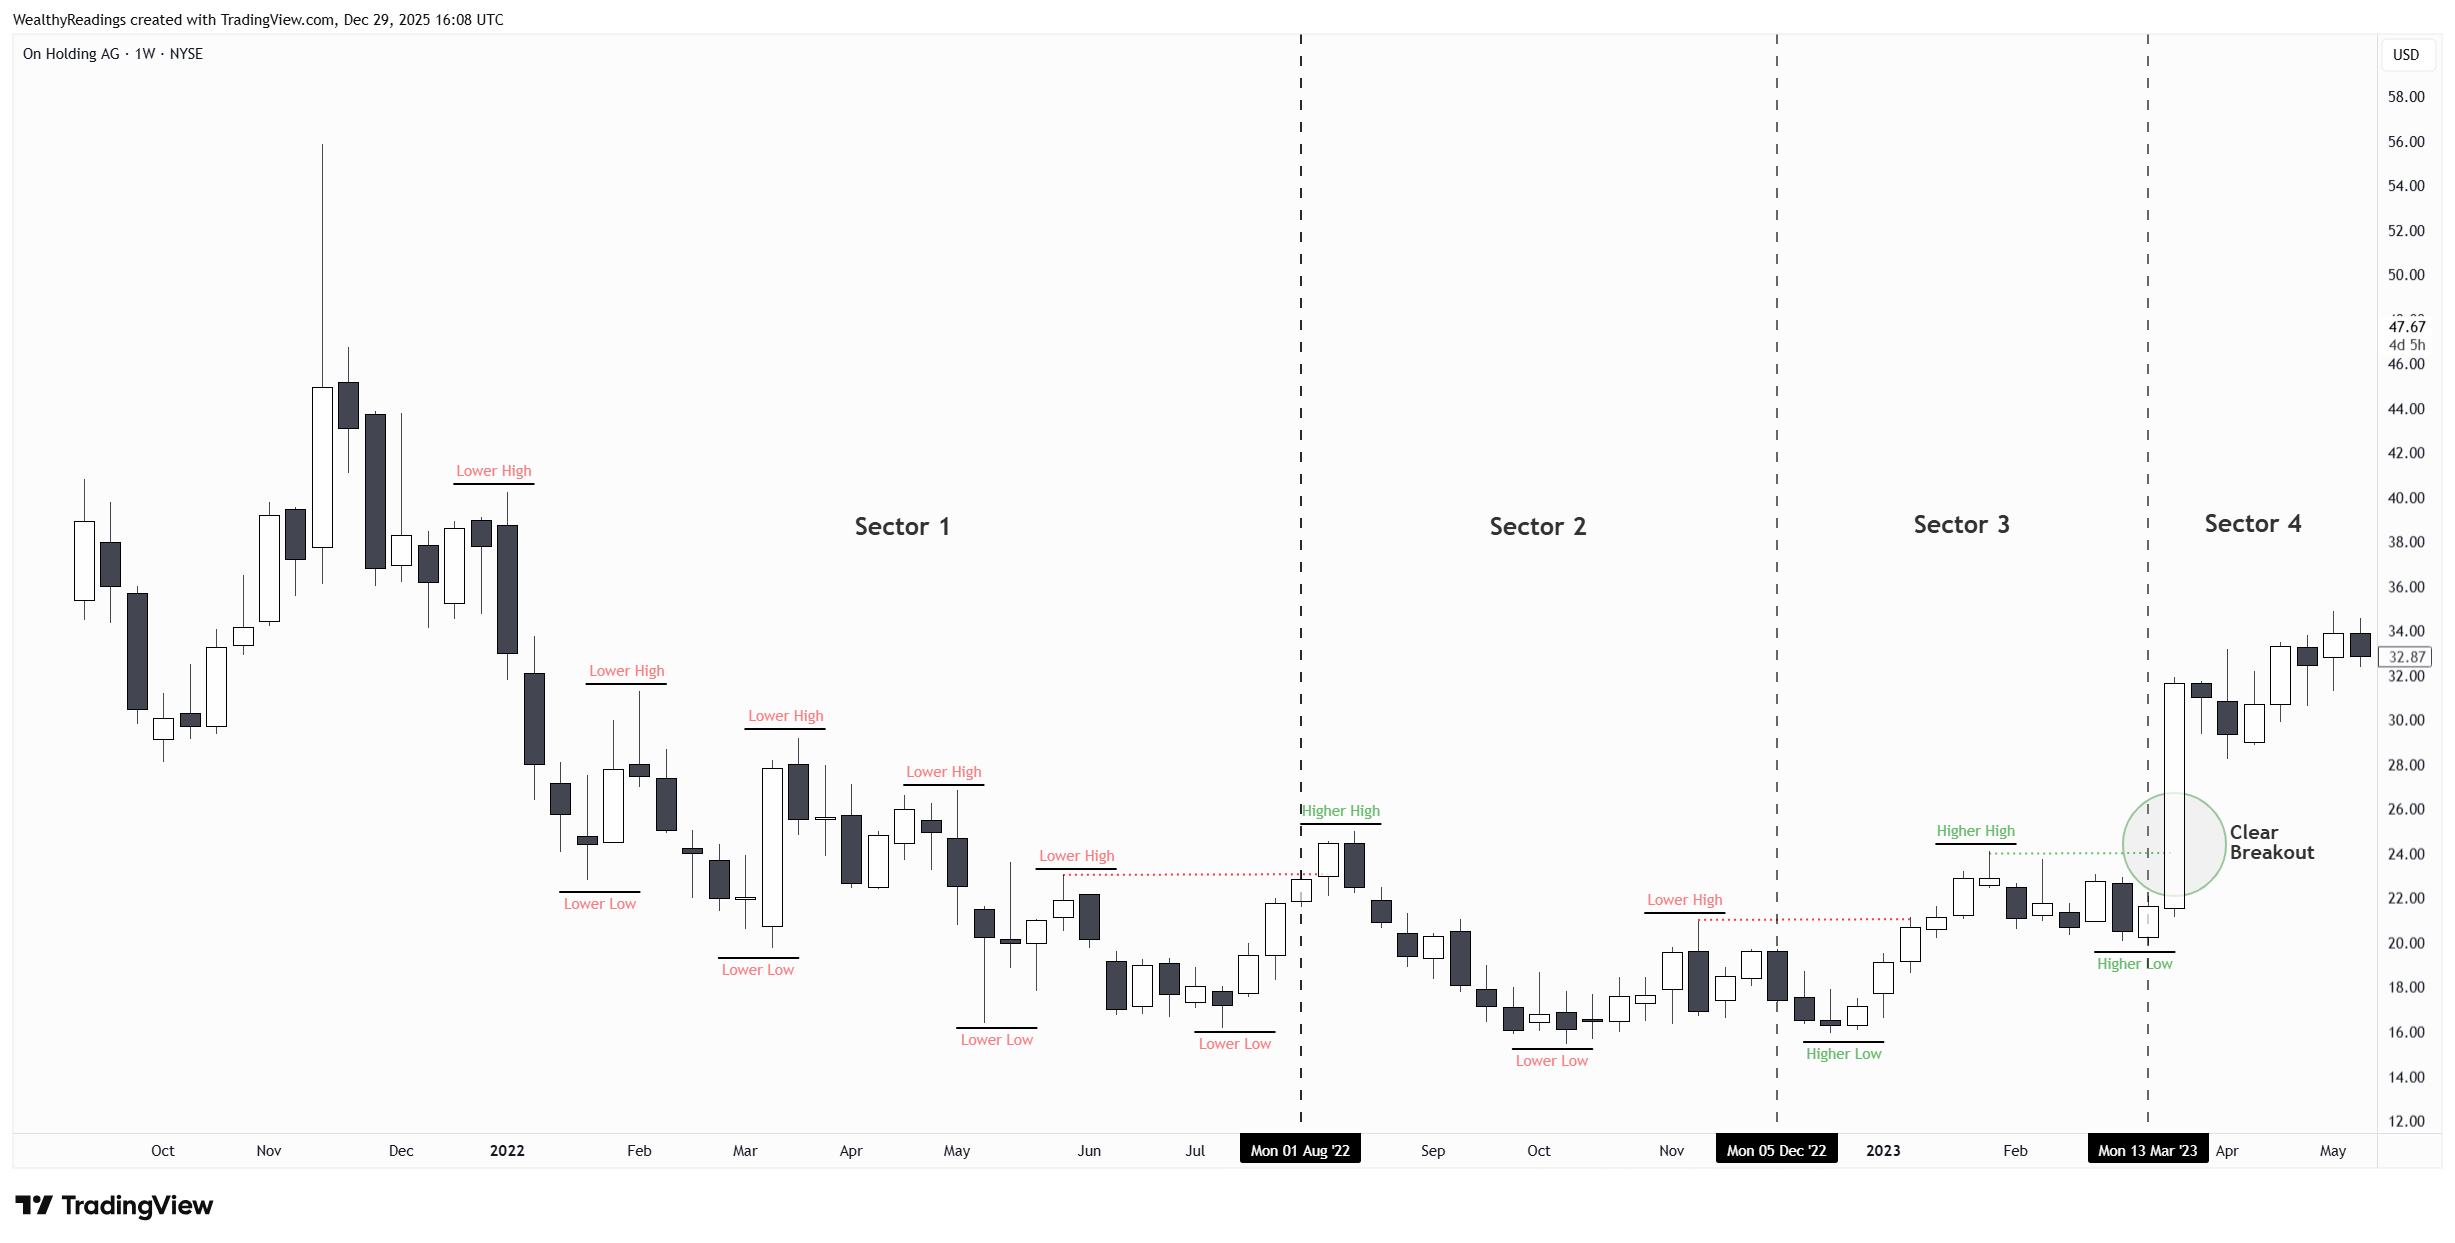
Lots of information, but let’s break it down.
Sector 1 shows pure disinterest. The stock keeps falling because nobody wants to buy higher. You can have the name on your watchlist if fundamentals interest you, but there isn’t anything else to do there.
Sector 2 shows seller exhaustion and a rebound in interest. You see a higher high in August, after two almost identical lower lows and a third one barely lower in October. Sellers are tired, buyers start to show up. It’s time to look a bit closer.
Sector 3 gives you the confirmation you needed: the stock doesn’t retest its late 2022 low. Why? Because buyers stepped in earlier meaning they were impatient. They wanted to get in at a higher price. And that pushed the price even higher in January. Investors are now willing to pay more. This stock became buyable with a small position assuming strong fundamentals and price below OCB by now.
Sector 4 is the final confirmation - especially since it happened after earnings. The chart won’t tell you that, which is why fundamentals matter, but it tells you that the market is ready to pay more for the stock by buying at a higher price at the lows, and pushing it higher at the highs. It is now time to go big.
Aggressive accumulation is done by buying retests and moving averages, the levels every investor watches during an uptrend. These are the self‑fulfilling prophecies that keep the trend alive. The patterns are always the same.
Ranges from hesitation
Breakouts with higher highs and higher lows
Retests as the market revisits the breakout level
Retests are simple human behavior. When a stock shoots up to new highs, investors take profits. For a moment, sellers outnumber buyers, and price cools down until it returns to the breakout level - or close to. If the uptrend is strong and fundamentals remain healthy, buyers step back in as we’re back at what consensus judged to be a very interesting price few weeks earlier.
Who passes on that kind of opportunities?
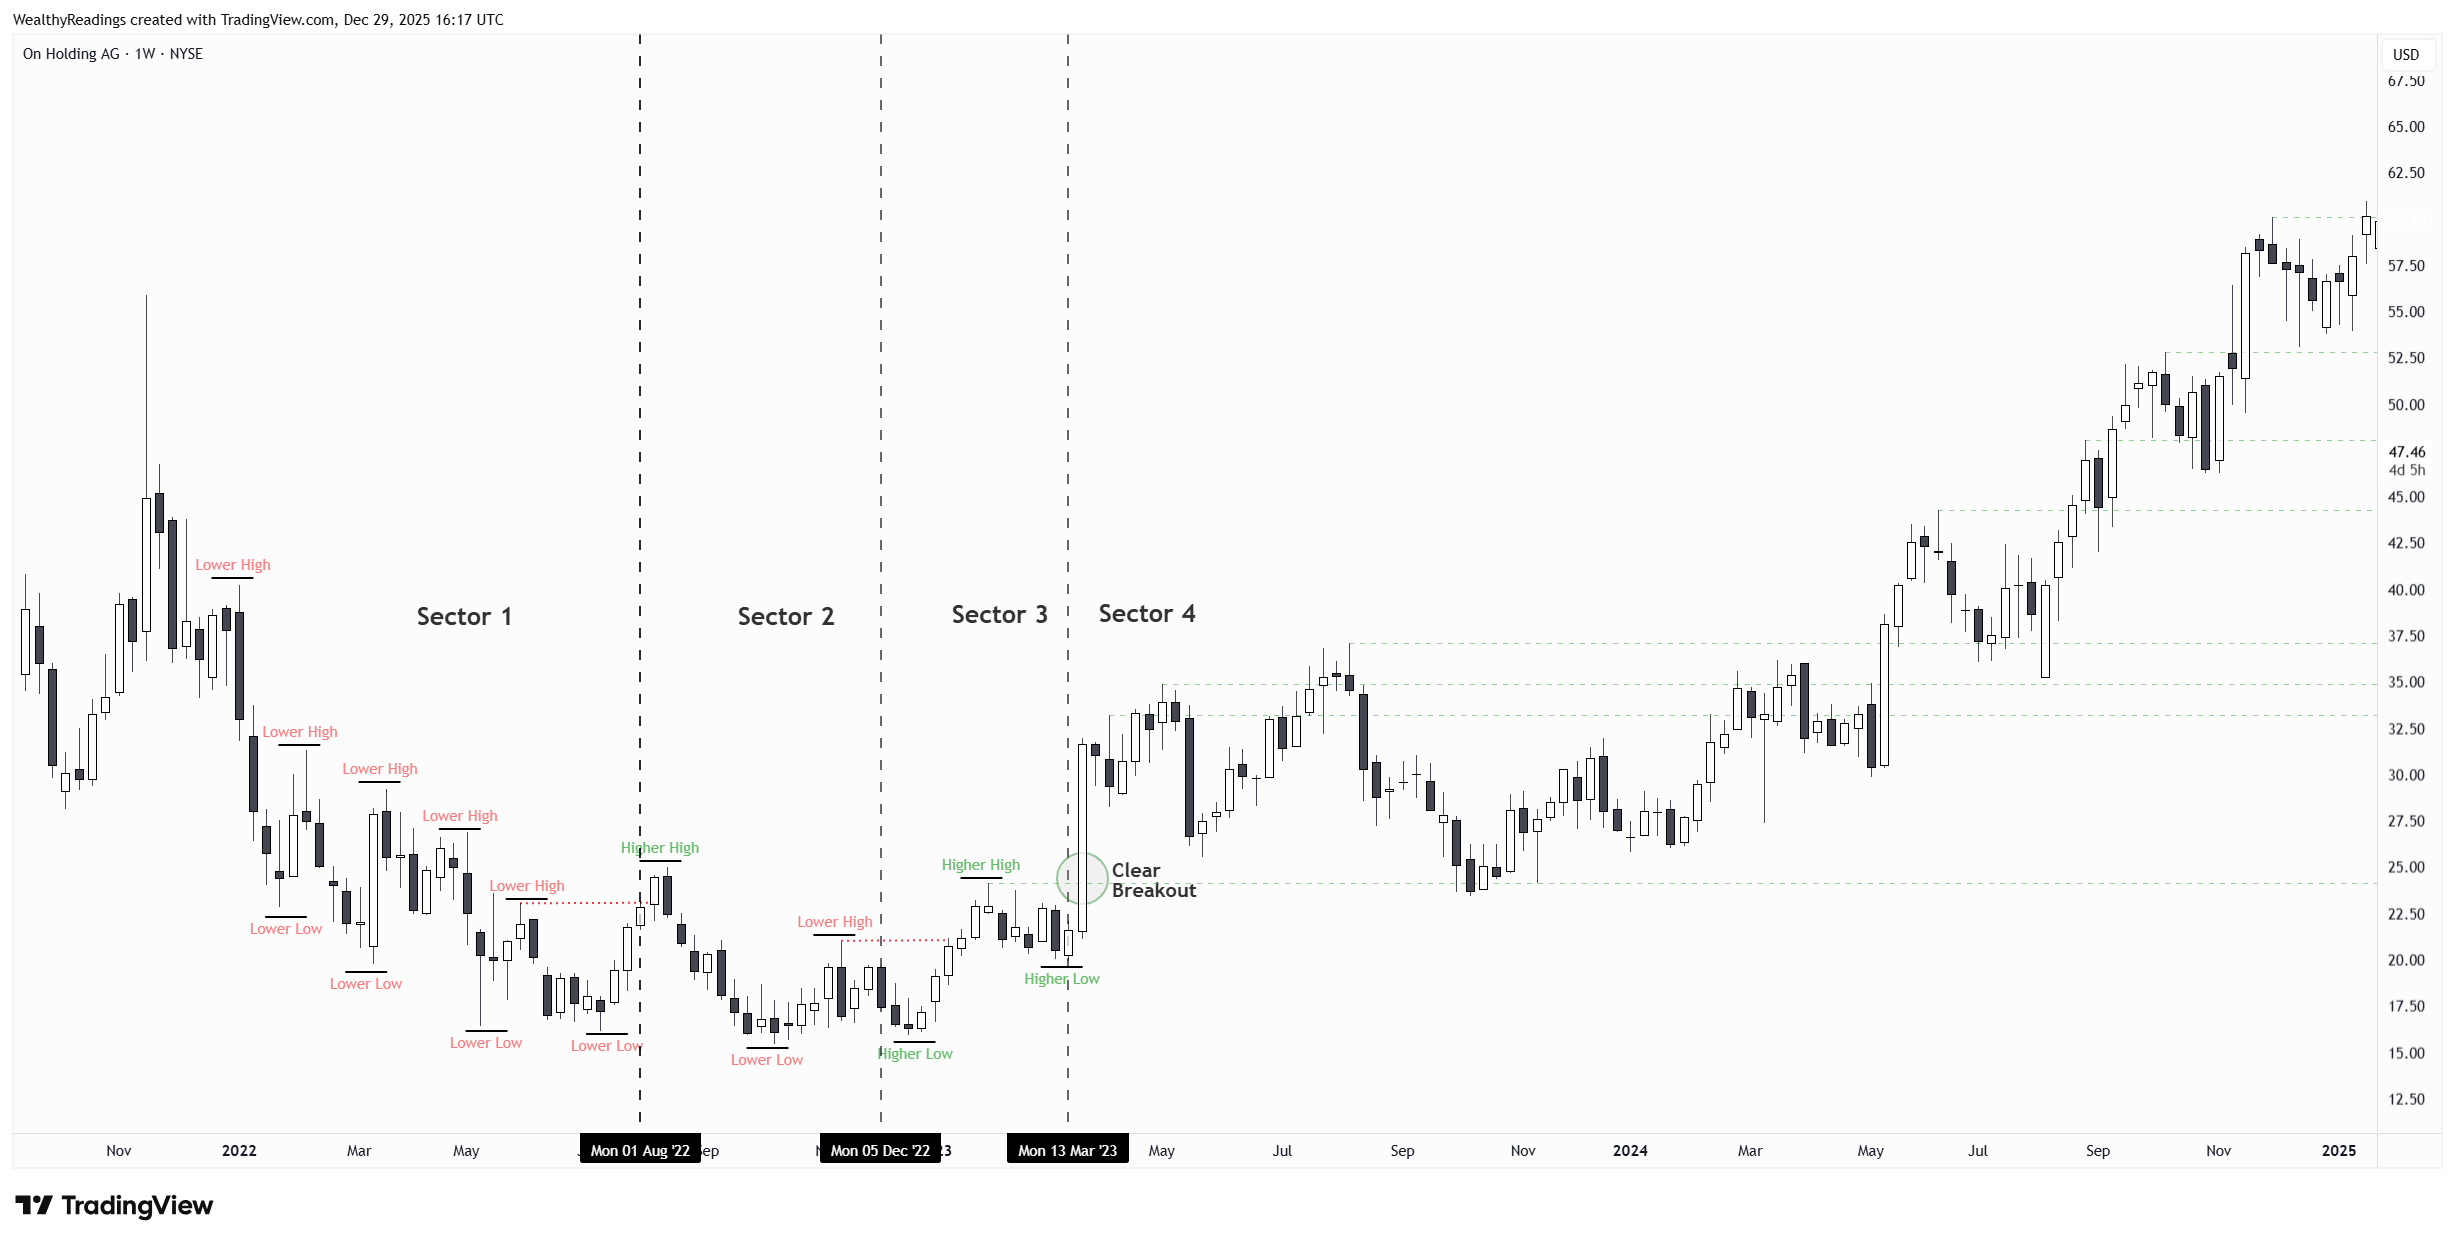
Every higher high after the breakout in the example above is marked by a green line. And every time the stock pushed higher, it came back to that line - or very close. As long as buyers step in at those levels, demand remains strong.
That is when we buy, and we do so until the trend stops.
In On Running’s case, the example above took 88 weeks and returned 151% from the first retest in June 2023 to the top in January 2025. If you were more aggressive and bought Sector 3, it lasted 98 weeks for 222%.
See, when I tell you I have no issues holding a stock for years, I meant it.
The second self‑fulfilling prophecy is moving averages. They’re just smoothed‑out price action; three of them are watched religiously: the 21, 50, and 200 - red, green and grey respectively in my charts.
Once again: they matter only because everyone looks at them.
Take TransMedics. Over the last six months, buyers stepped in every single time on the weekly 50. That created a series of extremely healthy higher lows. Coincidence?
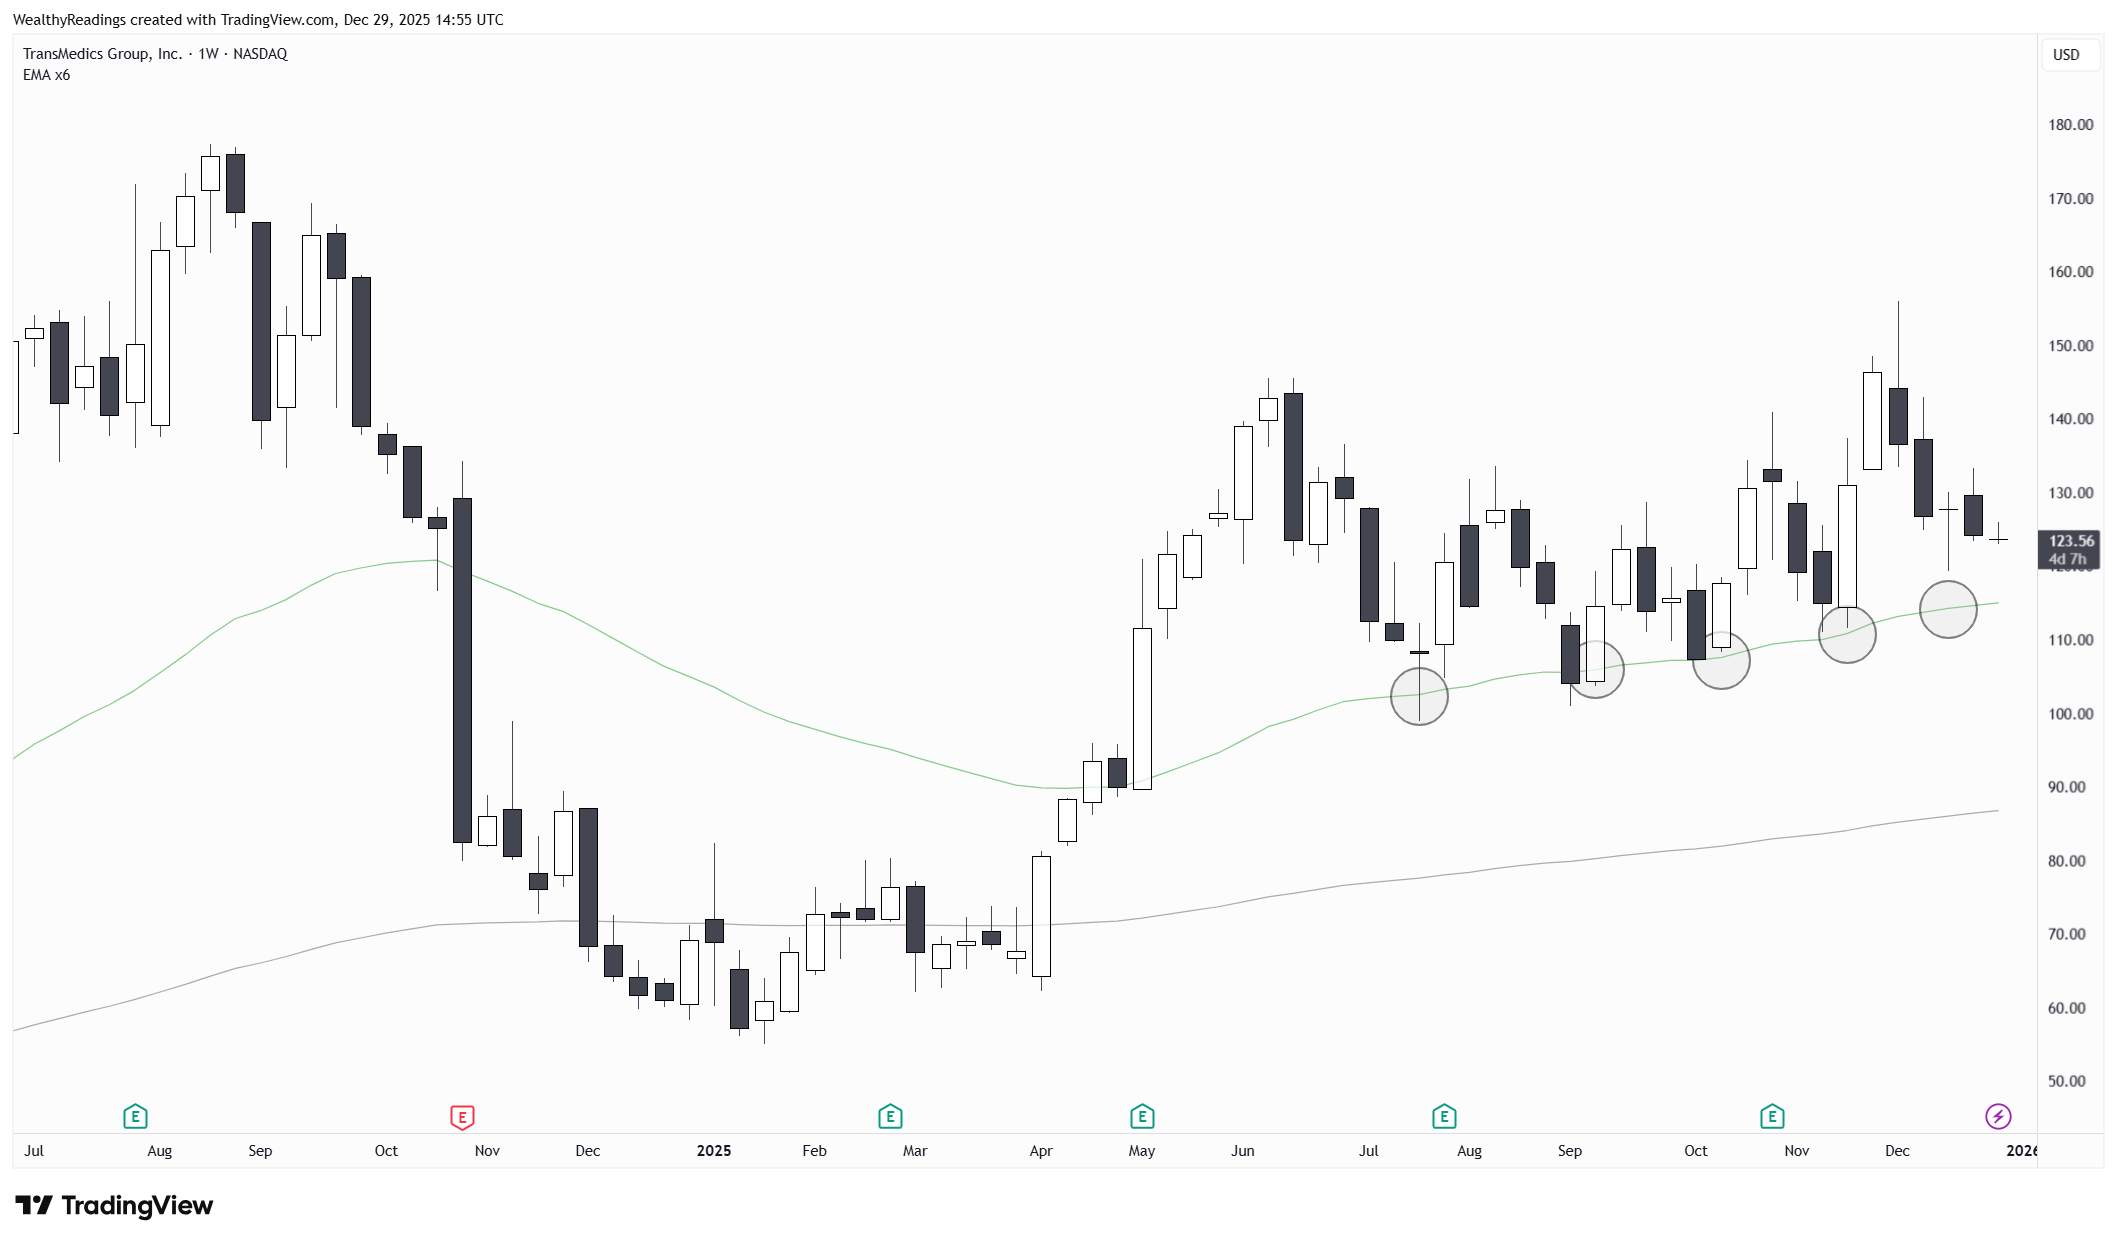
There are no coincidences in a place where millions of people interact for hours every day. There is only information, and it’s our job to read it.
Price action is the visual representation of buyers and sellers. It tells you who wants what, and at what price. That’s key information if you want to maximize returns.
Every stock has a “primary pattern” - the one most participants watch. For some it’s breakouts, for others it’s moving averages. Our job is to identify it and use it to be aggressive at the right time - which has nothing to do with timing the market. There’s no one‑size‑fits‑all rule, but there are universal principles.
Money is made when stocks go up. Everything else is noise.
Why don’t I buy downtrends?
Downtrends are the market’s words to tell you something is wrong. Sometimes it’s an overreaction, but often the market understands things we don’t.
If you buy a downtrend & you’re wrong, you end up holding degrading fundamentals. Even if you’re right, you risk years of underperformance waiting for the market to realize its mistake - and that delay gives risks time to materialize.
Markets don’t care about “cheap” valuations in downtrends. Stocks can fall far below any analyst target simply due to lack of interest.
I also showed on this write‑up that averaging down is usually a waste of time, energy, and mental health. Watching your position shrink doesn’t help you sleep while being patient gives you the same average cost without any of the stress.
Buying a downtrend is pretentious. You assume you know better than the market’s consensus - and you won’t 99% of the time. And even if you are right, you have no guarantee the market will recognize it anytime soon. Could be months. Could be years. And your positions will be shrinking in the meantime, the risks grow, and you won’t be sleeping very well.
Following price action reduces risks. Let the market tell you you’re right. Then go big.
Position Sizing & Options.
Concentration is king. I hold a maximum of 5 different narratives at once - two stocks can fit into one narrative.
Minimum Size: 5% of the portfolio. If I’m not willing to put 5% in, I shouldn’t own it at all and would be better growing other positions.
Maximum Size: Whatever lets me sleep at night. I don’t mind having 40% in one name if my conviction is high. If I don’t worry about it, it’s not too big. I’d even go 90% on a once-in-a-decade opportunity like Google at $150 in April 2025.
Options & Leverage: I only use these on my strongest convictions and perfect timings - breakout + retest largely below OCB. These tools are dangerous; I only touch them when the risk is at its absolute lowest.
Substrack & Objectives.
Now that you understand what I do and how I invest, here is what you can expect from me and this Substrack. In brief, complete and regular follow‑ups of a few key assets, with clear strategies & execution setups so you can beat the market with confidence. This breaks down into a few core write‑ups:
Investment Theses for companies I believe are great buys - fundamentals, narrative, potential catalysts (cash generation or multiple expansion), valuation, and execution (how I plan to buy and when).
Quarterly Earnings Reviews for companies I own or on my watchlist to control the thesis, update valuation with fresh data & align it with price action and execution.
Regular Follow‑Ups. Interviews, valuation updates, key developments… anything that matters outside of earnings. A thesis evolves over years; we track it.
Monthly Investment Plans. A full review of my positions and watchlist, with my view of the market, how I’m navigating it and my plans for the month.
Weekly News (Sundays). A recap of the week’s important events, mostly market related, but I leave myself room to talk about anything I find interesting.
Everything is free for now.
Good content alone doesn’t deserve monetization; performance does. Everything will remain free until I prove, through transparent tools like SavvyTrader and my portfolio, that my methods beat the market and can help you achieve above‑average returns.
https://savvytrader.com/wealthyreadingspro/buyandhodl
Once proven valuable, the content will be monetized through subscriptions.
I don’t know when, how, or at what price yet, but most execution‑focused content - Investment plans, valuation, execution, SavvyTrader… will end up behind a paywall at some point.
For now, everything is free. And it stays free until I prove myself. I just want to be as straightforward and transparent as possible about where this is headed.
Now, you know everything. Welcome, and let’s work together towards achieving great returns! Performance belongs to those who work for it.
Earnings × P/E = Market Capitalization
Earnings × ROIC = Intrinsic Value
Weighing Ratio
= Market Capitalization ÷ Intrinsic Value
= P/E ÷ ROIC
.
Benjamin Graham — 'In the short run, the market is a voting machine but in the long run, it is a weighing machine.'
I’ve been studying for a long time but always fundamental value investing. I do fine buying at bottoms but always sell too early. That’s why I need to learn to spot a try change in upward momentum.