
Buy & Hold Portfolio | Trimming Palantir
How & why I trim my stocks | Palantir's use case.

I’ve always said that fundamentals, research & convictions matter, but beating the market comes down to execution. That’s what these write-ups will be about.
I already share my aggressive position through the Portfolio Modifications write-ups; it is only normal that I do the equivalent for my Buy & Hold portfolio. I won’t share each transaction but regularly send this format to share the stocks I consider to be the best buys under current market conditions.
Returns over the long term depend on the prioritization of our liquidity, which should flow from our highly valued assets towards the best opportunity at any point in time. These write-ups are meant to present those best opportunities, based on my opinion & the companies I follow.
You’ll find the portfolio below if you wish to subscribe & have alerts for transactions at the moment I do them.
https://savvytrader.com/wealthyreadingspro/buyandhodl
My goal is to deliver alpha over the long term, not just six months under easy market conditions. If/when proven this content is valuable, it will be shared behind a paywall. No rush, though; it’ll stay free until proven valuable - quarters of outperformance.
Nothing shared here is financial advice; we are all responsible for ourselves.
We’re going to do something different today as I’ll detail my process on trimming my long term positions using Palantir as a use case - which I trimmed yesterday. You will not find it on my SavvyTrader as I bought it back in 2023 & did not use the platform back then - didn’t write neither.
I do not trim stocks for pleasure, I try to only trim when I believe having liquidity will come in handy or if there are better opportunities on the market, and if a bulk of conditions are met.
How Do I Trim?
I have a few criteria before trimming a long term positions, and would not trim if only one of them were true; Performance, valuation or price action are not enough by themselves to sell shares for example.
Global Market Indicators.
The S&P500 is the leader, the one every liquidity owner looks at to make its decisions and the one who leads uptrends & downtrends. Any sign of weakness or extension is a call to look at my stocks to see if I could trim some fat & build some cash.
There are many ways to do this, I personally like to look at the 20EMA which is a great indicator of short to medium term performance. Today, the S&P500 trades more than 6% above this EMA, which has been a sign of overextension those last years, usually followed by a month of lower returns or a small correction - I am not talking bear market here, no reasons to be frighten by only one indicator.
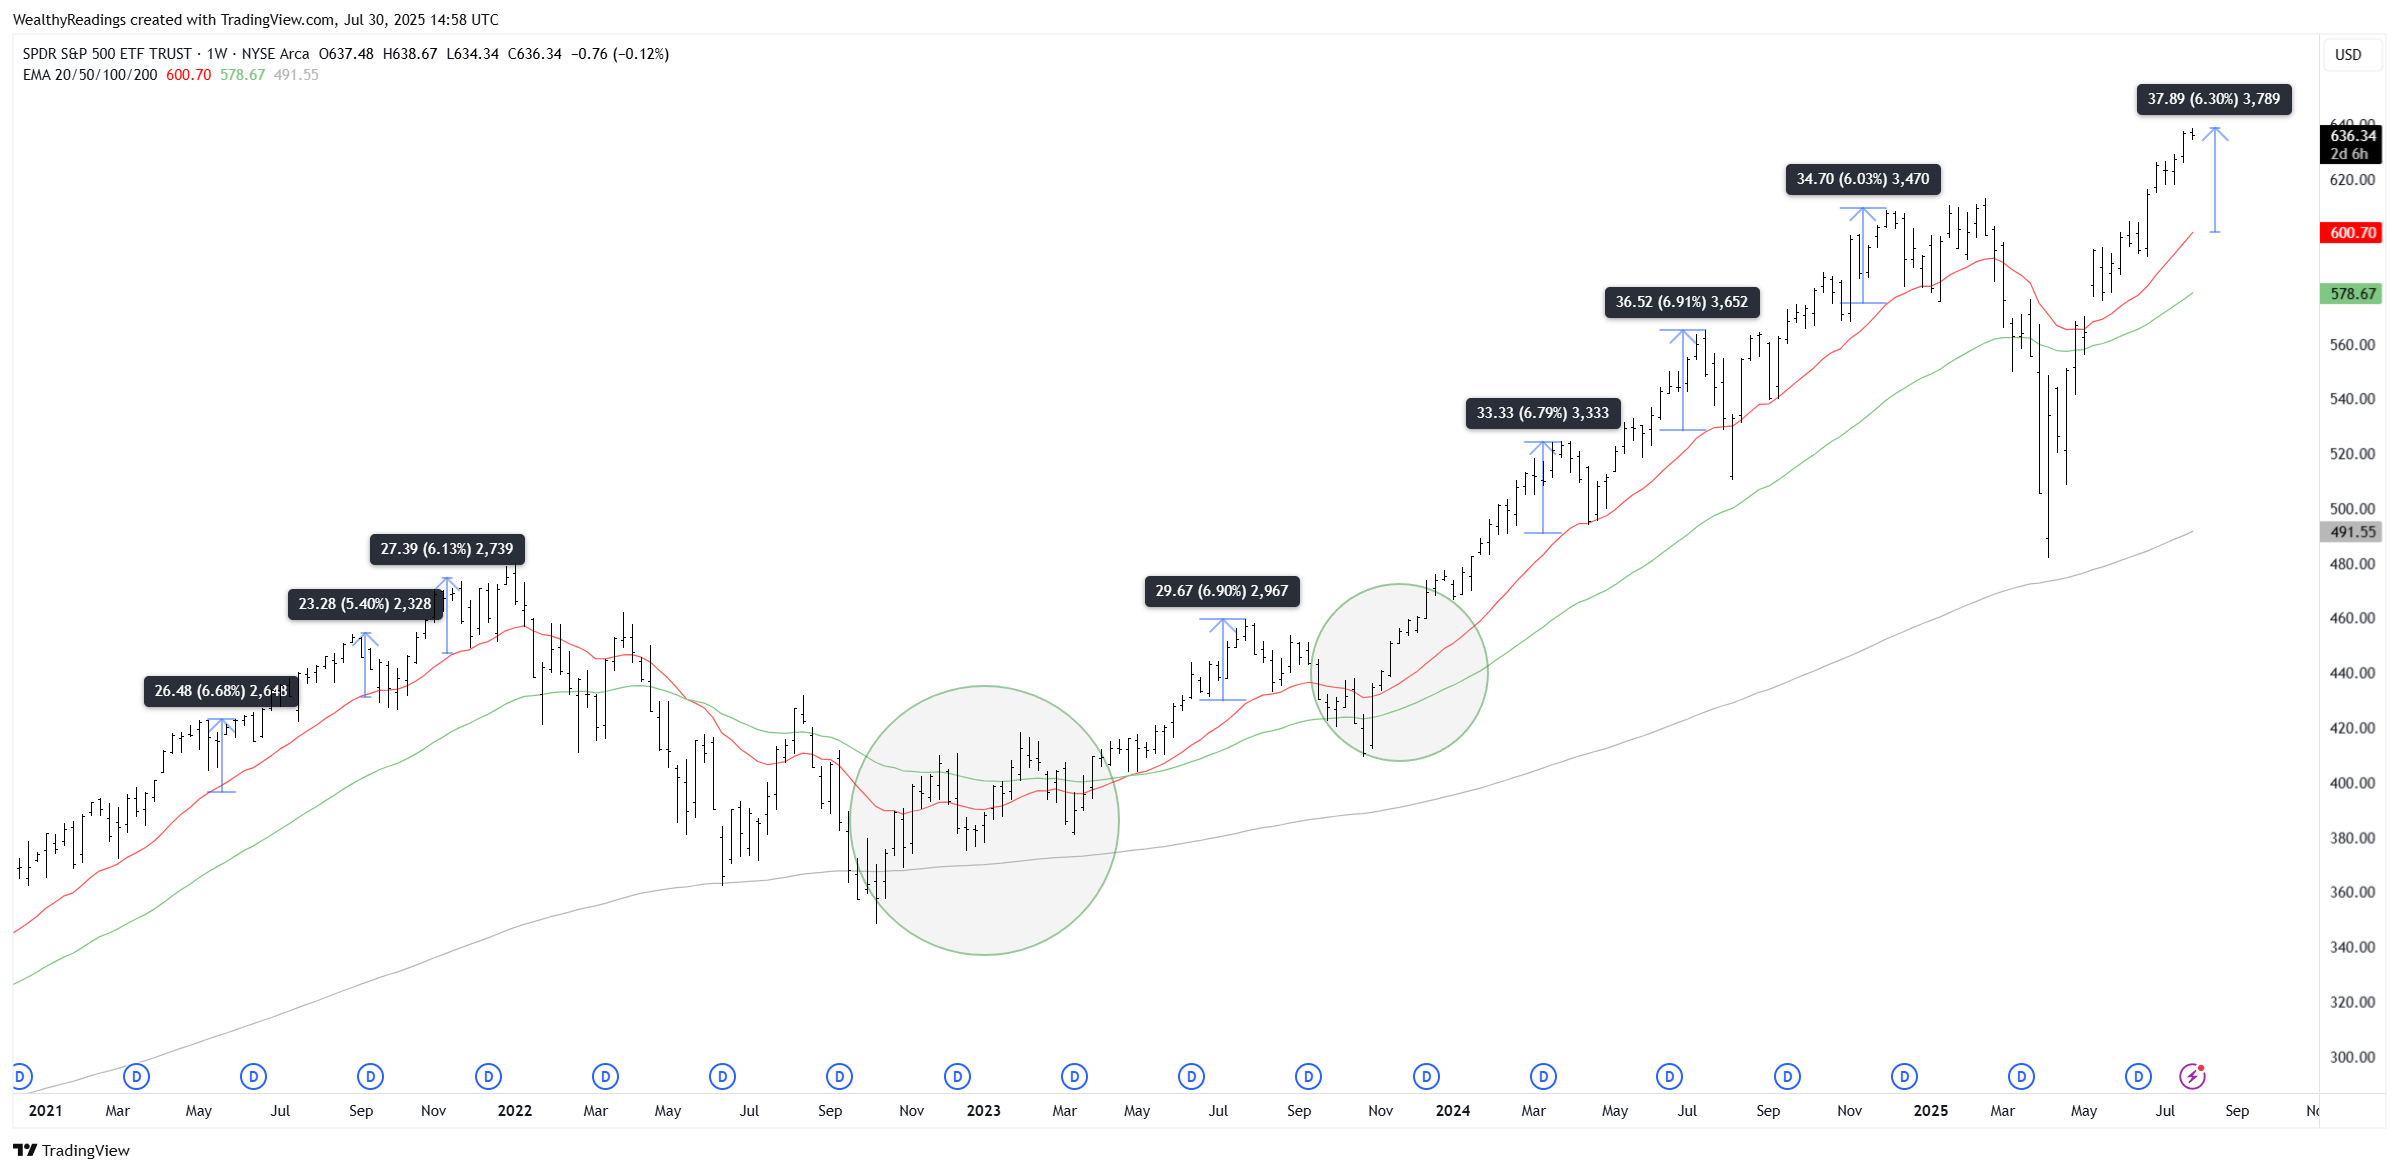
It doesn’t mean it will happen, we could simply run flat for some time while the EMA catches up, but it is a possibility.
The fear & greed indicator is also a good tool. The markets can stay long in greed, but extreme greed is usually not sustained more than a few days & losing it is also usually followed by some weakness.
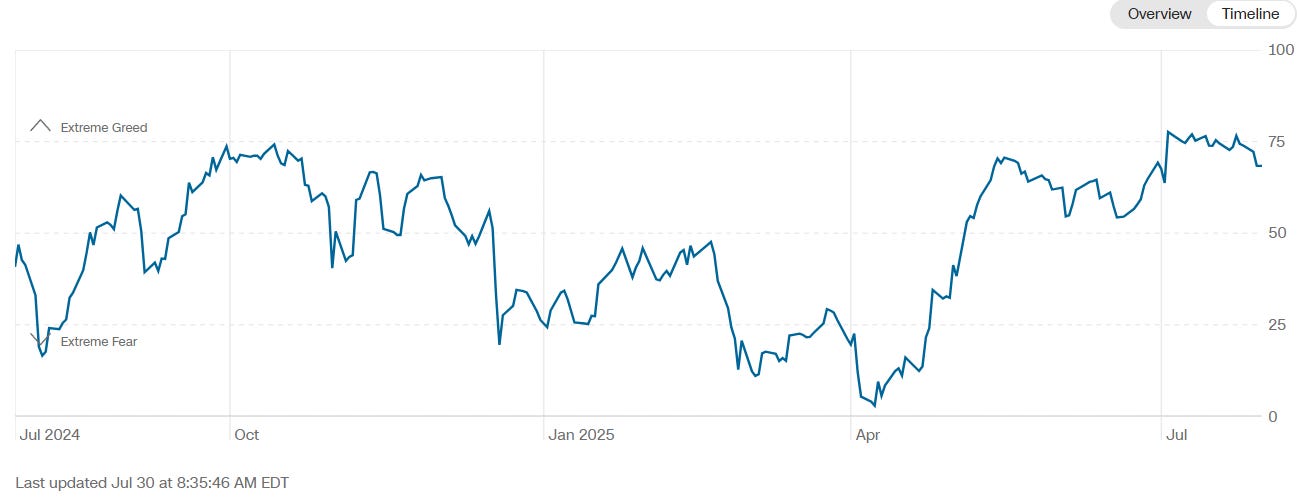
Once again. It doesn’t mean we going straight to extreme fear like in April. Simply that the market is really optimistic lately, and this might be changing.
Those are two known and simple tools, which aren’t enough to make a decision but give indications on the global sentiment of the market. Too optimistic is a great time to trim. Too pessimistic is a great time to buy.
We are pretty optimistic right now after 30%+ returns in a few months.
Valuation.
Stocks trade at multiples - sales, earnings, etc… and those bounce depending on the market’s view of a particular stock. There are no limits on how high or how low the market can bring multiples as they swing not depending on fundamentals, but emotions, which is why valuation by itself is not enough to sell or buy a stock.
Those who sold Palantir because 30x sales was too much - or so they thought, lost tons of returns… Personal assumptions do not matter in the market. Valuation is a great indicator on the market’s excitation for a stock. Nothing else.
But it is a great tool for investors to assume potential returns, how far a stock could run from here and if it makes sense or not. Returns might have capped or risks might be higher than with another asset, and this reflexion could trigger a liquidity rotation towards an asset with more potential.
Price Action.
One of the best tool to use to anticipate stocks reactions as price action usually gives indications before anything happens. I use two different methods to trim my stocks: momentum & resistances.
Momentum is a measure of returns acceleration and can diverge, giving indications on a trend strength. We have bearish divergences when the stock price goes higher while momentum declines, as shared on the screenshot below - which is the daily chart of the S&P500.
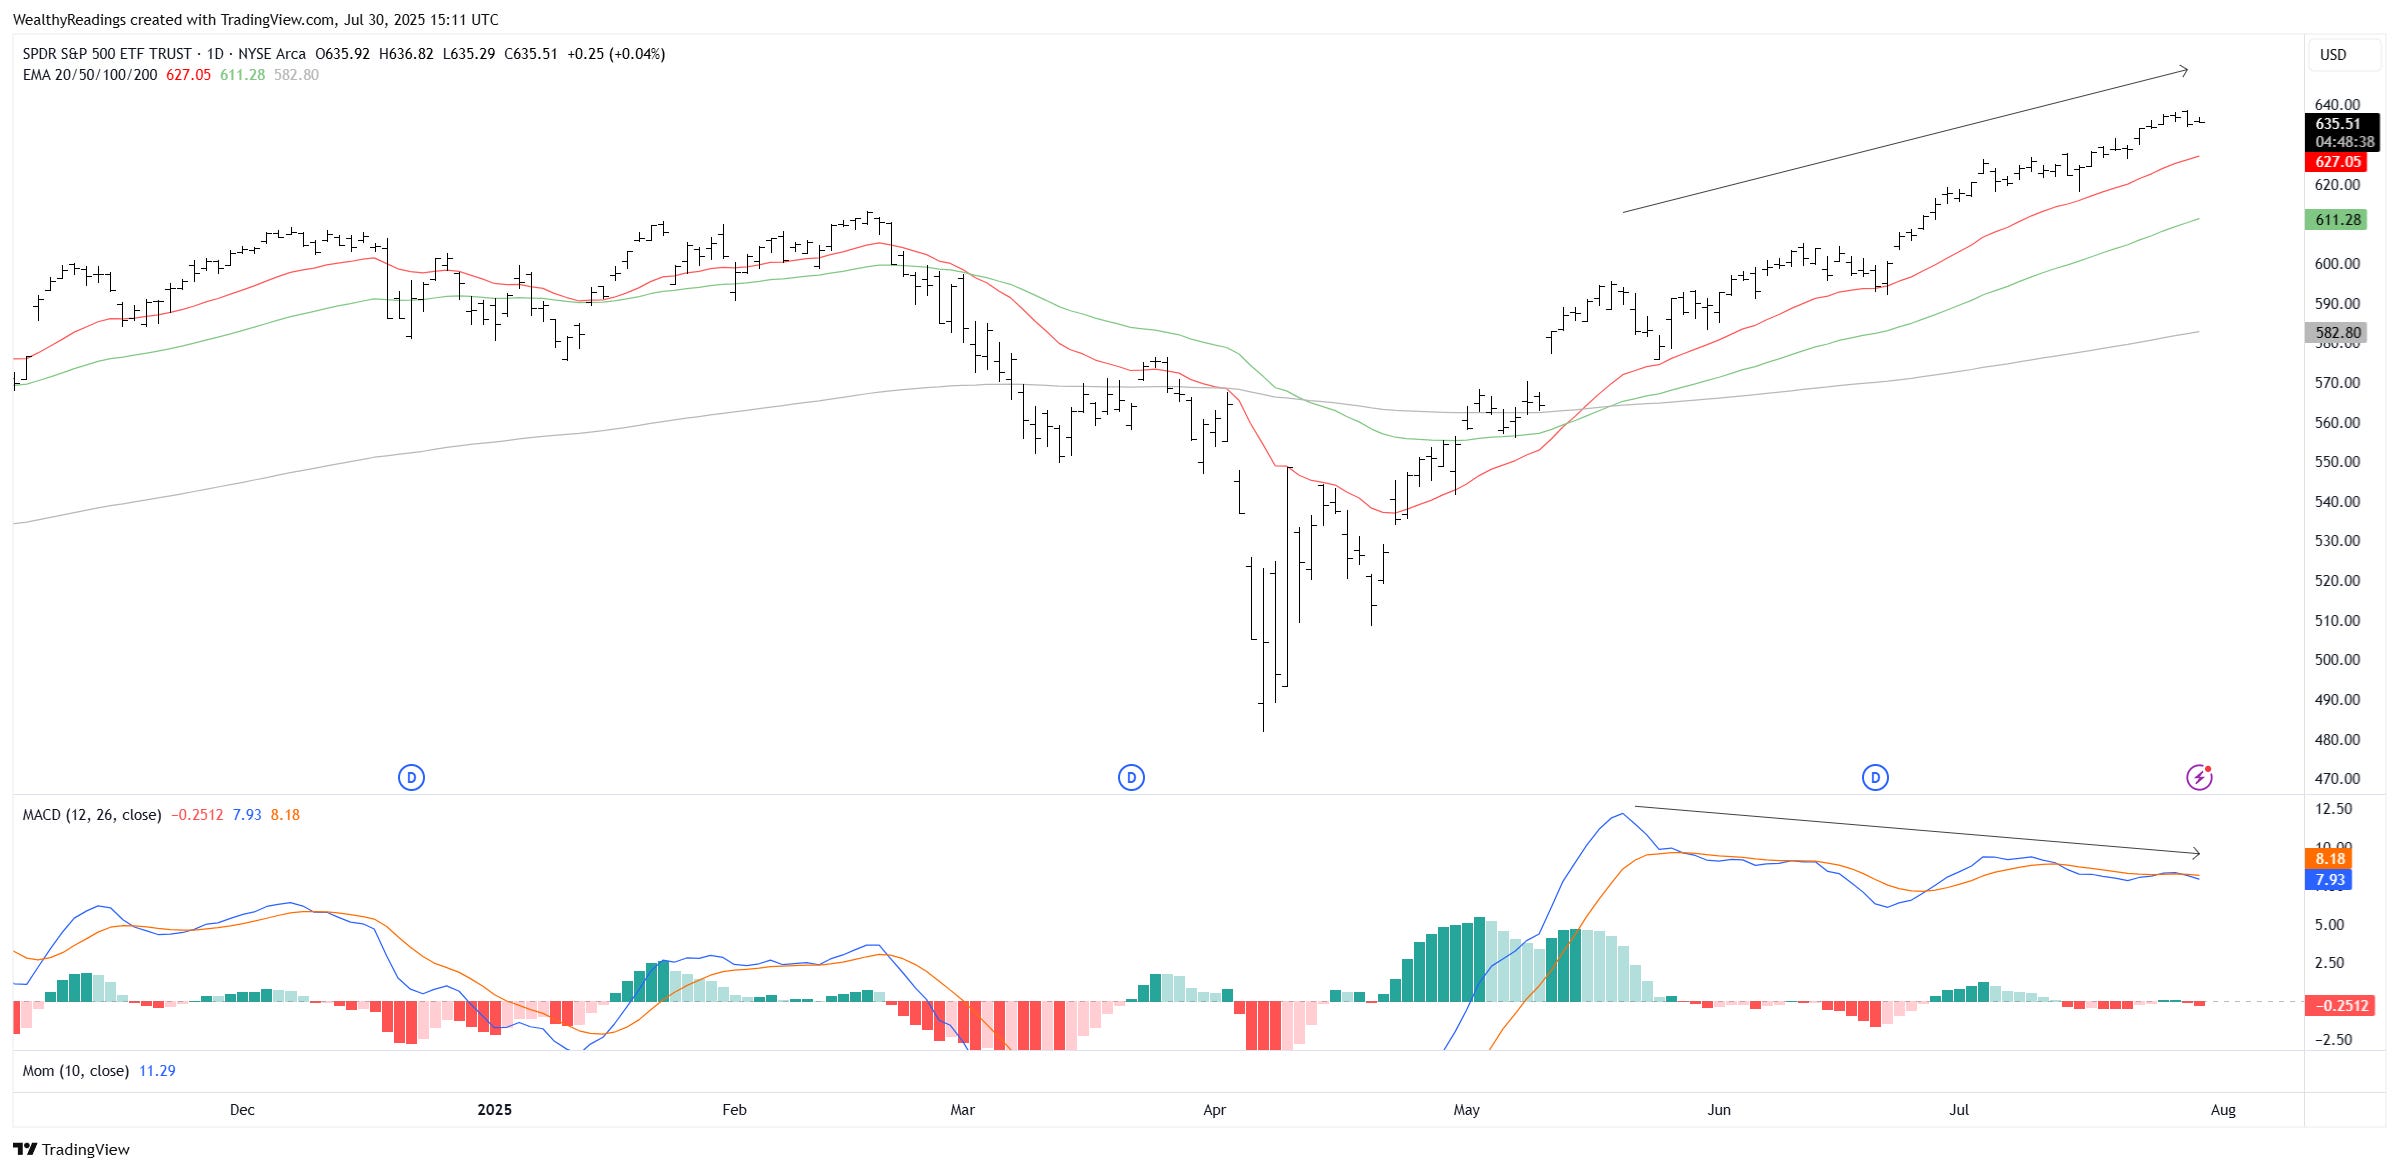
This means the asset continues to go higher while the returns rates are slowing - the trend is losing energy. Those are usually pretty strong indicators as it shows a lower excitation while prices continue to rip, exactly like you would push for that last mile running while you already are very tired - and you know it’ll cost you later.
This is the same mechanism, and the opposite also exists - bullish divergence show a growing energy while asset price continues to decline, and are usually good buying regions - and I also use them.
Secondly, I look at resistances as it is always better to trim an asset on a known sold area. The likelihood of it being broken is lower than price action bouncing on it and we could either way re-accumulate if the stock were to breakout and only lose a few percentage points in the operation - while increasing safety.
Correlation.
Once again - and I need to emphasize this.
Those indicators are worthless by themselves & I need most - usually all, of them to be true before I trim any of my long term position.
Palantir.
If you do not know about one of the best AI stocks on the market, you are making a mistake. Palantir is worth spending time on.

Global Market Indicators.
I already shared the data above.
The S&P500 is extended from its 21EMA, with daily bearish divergences and we have been flirting with extreme greed for the past two weeks.
Valuation.
Palantir is the 21st biggest capitalization in the American stock market, between Home Depot & Procter & Gamble who respectively generate 55.7x & 29x more revenues.

Of course, both companies do not have accelerating revenues above 30% per year and are not pillars in the most hyped sector of the market - being AI, but there still should be a correlation between revenues, income, FCF & capitalization.
The market rewards Palantir for its amazing quarters, accelerating growth and impact on its clients as many of them start to speak out on how transformative AIP has been for their company, driving efficiency higher than they could have dreamed of.
It rewarded it to the point where Palantir trades at 125x sales and 680x earnings. I included Google on the screenshot so you can see the difference - while Google is arguably not less transformative & generates many times Palantir’s cash.

Clearly: multiples are extended but they are since long - which highlights my first comments that we should not sell stocks only based on our personal view of their multiples.
We could ask ourselves more questions about opportunity costs to be sure about our decision on the stock’s valuation & decide how much we will trim. Palantir is a special case as its multiples are new, but we could also use historical ranges on a traditional stock to have an idea of how excited the market is, etc…
What about potential returns from there? Is it reasonable to expect Palantir to double assuming the company continues to accelerate growth? A $600B capitalization would place it next to Oracle, a pillar in compute & IT services - somehow comparable although once again with a much better cash generation.
Assuming Palantir grows 40% CAGR until FY26, it would generate $5.6B of revenues and $600B valuation would be 107x sales, close to today’s valuation. Is it impossible? Absolutely not but it doesn’t look like a base case.
Palantir is not growing 40% YTD now so we would need a continuous acceleration to reach this growth by FY26. Possible considering the fundamentals but starting to be unlikely. Having even higher expectations would require even more growth, so we could take this scenario as our best case scenario - already high expectations.
Aren’t there better opportunities on the market with better probabilities? Or wouldn’t we rather hold some cash for the moment? If the answer to one of those is yes, then the valuation criteria is checked.
Price Action.
Palantir has been printing new ATH each week so we do not have many resistances to look at, but momentum is interesting.
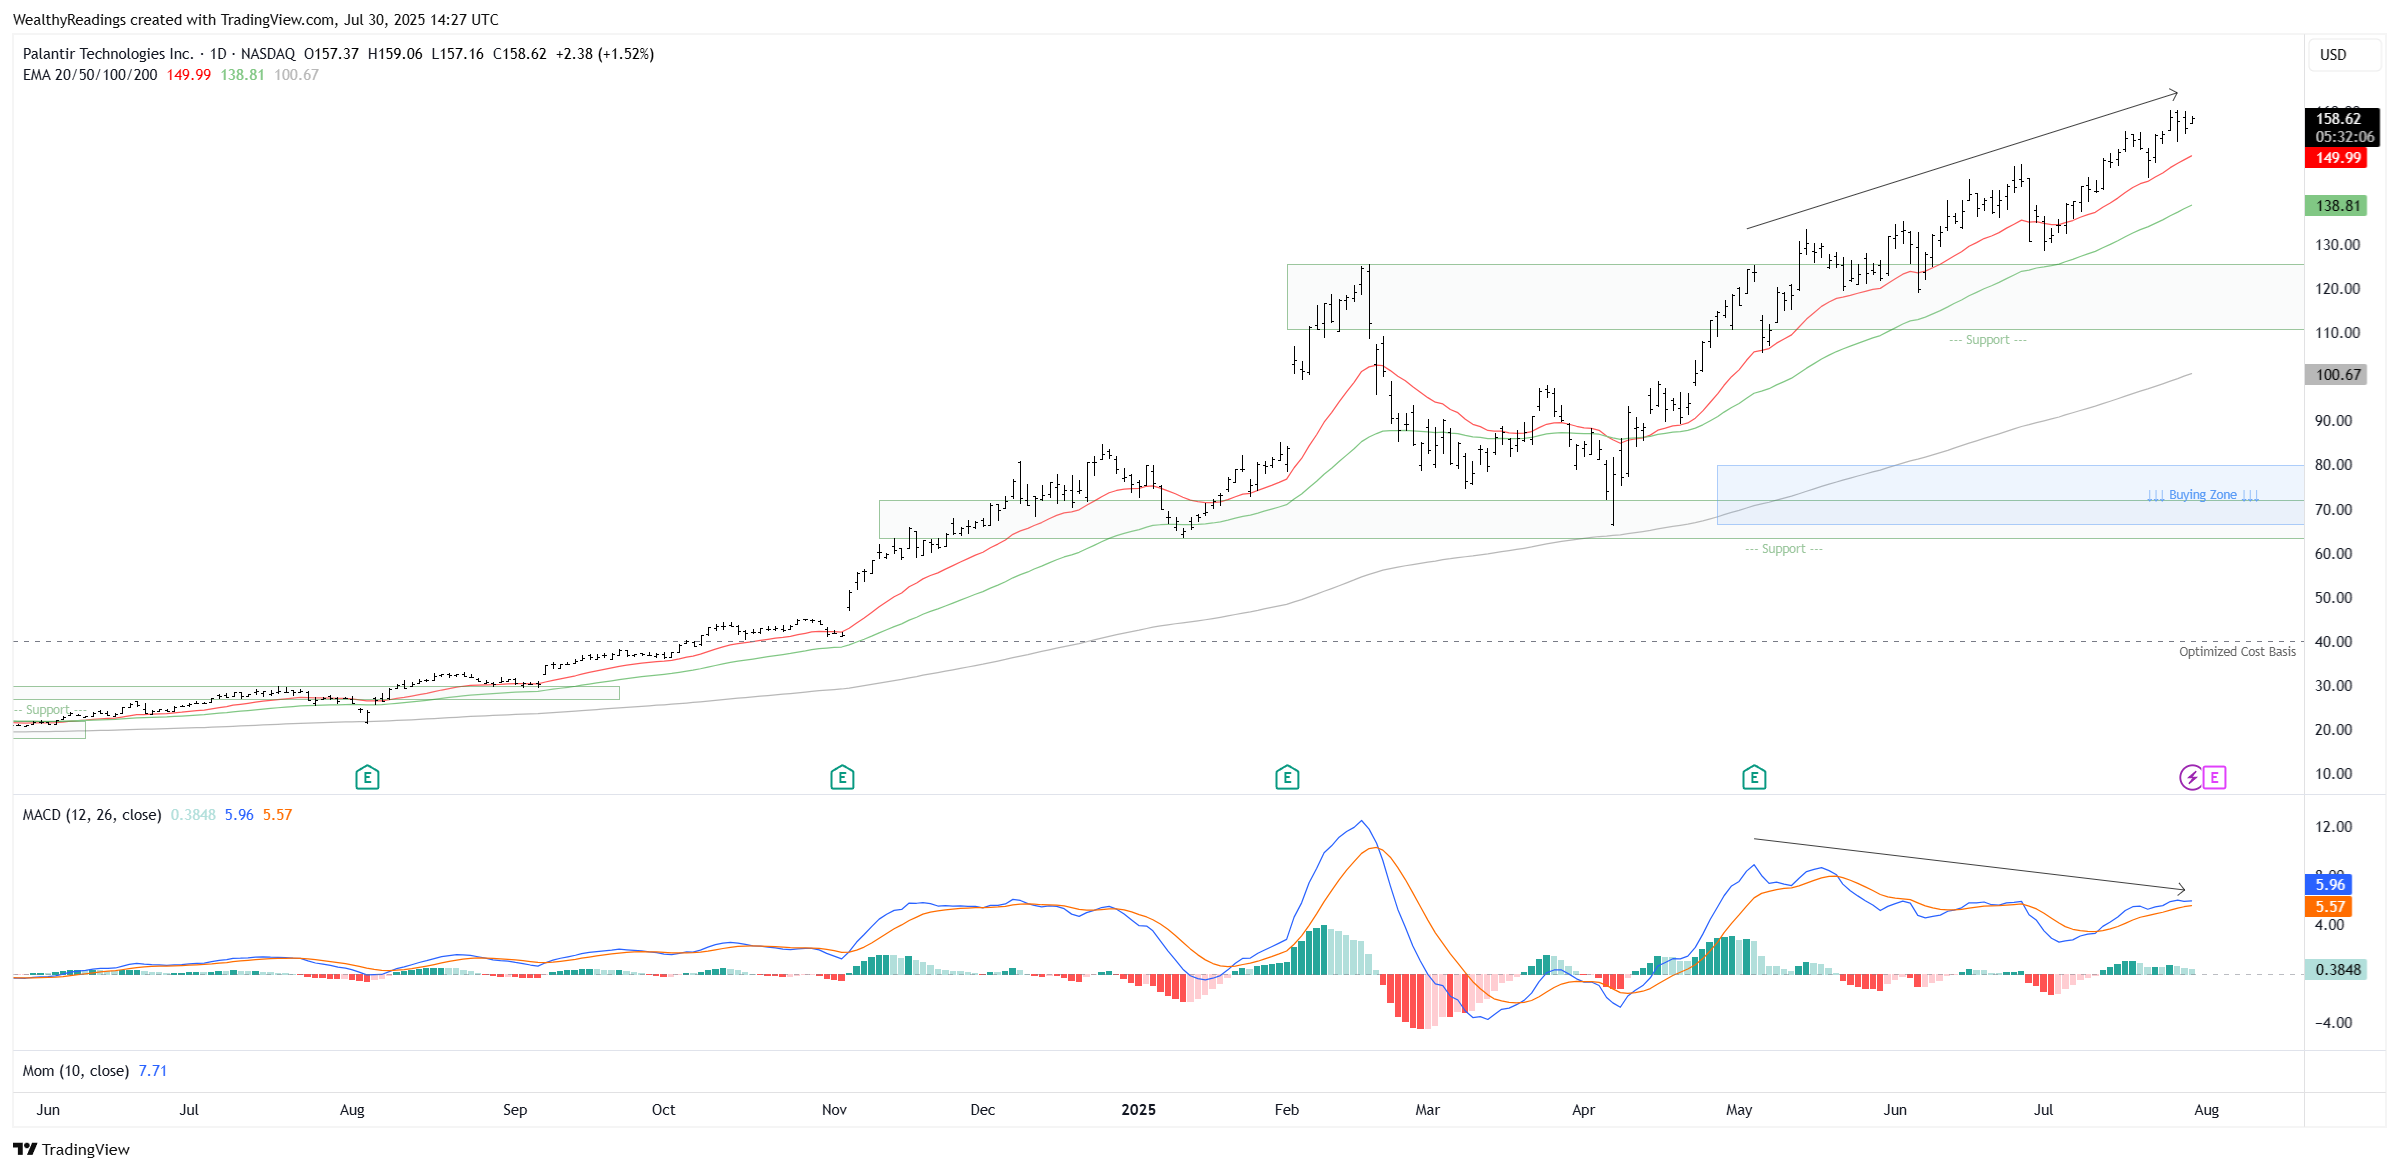
The stock has been rising for weeks, months even, with a decelerating rate. A slowing stock constantly printing new ATH on low volume is not necessarily the best indicator of strength. I would translate that as lots of holders but a much slower rate of buyers. How long until this slowness forces some to take profits? Or until one quarterly data is not as perfect as it should be?
Decision.
This is an example and I already trimmed Palantir yesterday - a good trim, but this was the reflection that led me to the decision.
The market is extended, the stock trades at high multiples without much room to yield significant returns - except under a massive bull case, I’d rather hold some cash and I consider that there are better opportunities out there, plus momentum is starting to show some weakness.
We have our trinity & it is enough for me to trim the position, the proportion depends on the situation & our needs. Do we simply want to raise a bit of cash? Do we want to open a massive position on another asset? Do we only want to reduce the downtrend risk on this one?
This last step is a case by case. But I use this process for each of my assets.